London: Emergency response simulation
Aim:
Optimizing emergency medical response time in central London area
#simulation #network #optimization
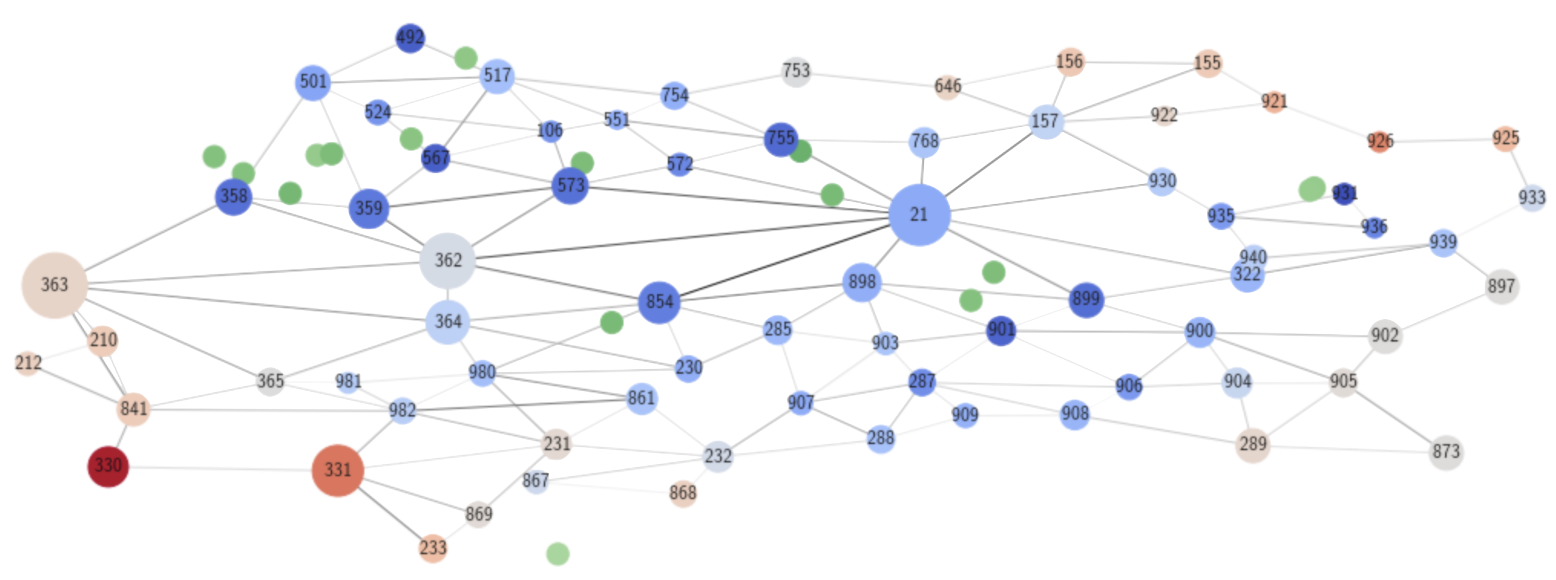
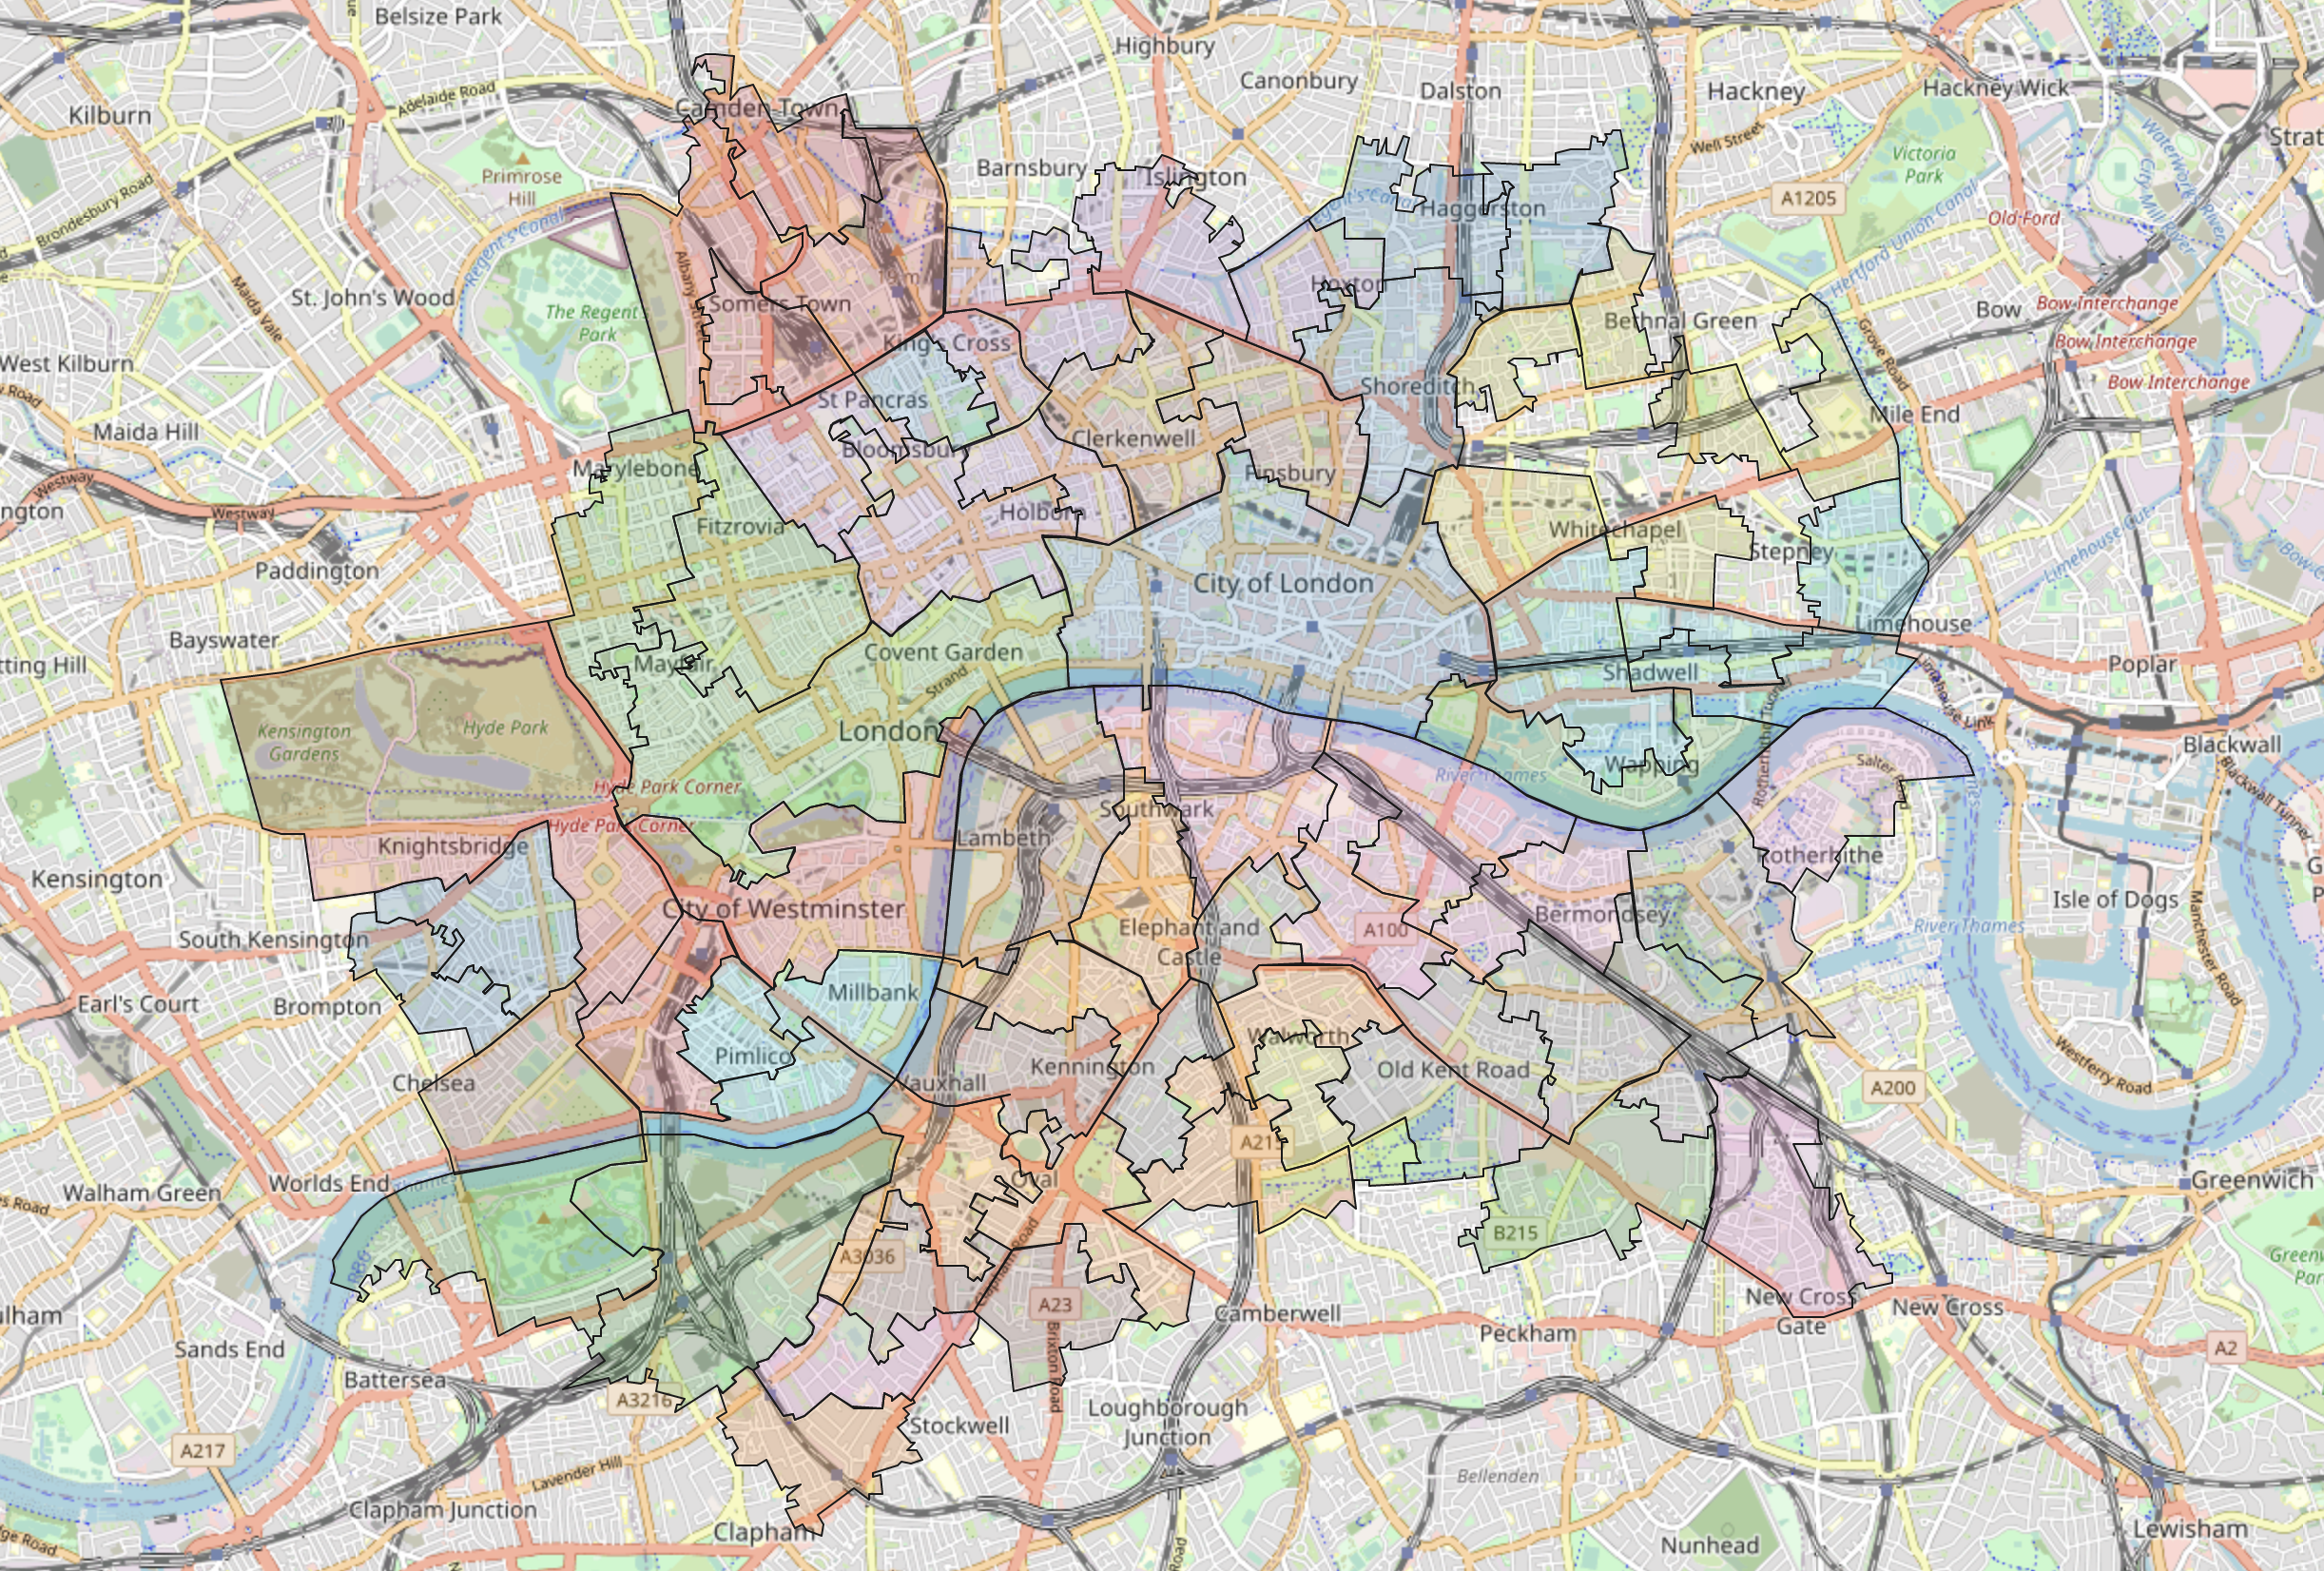
Using dataset obtained from the Uber Movement database, I constructed a network representation of the central London area. Each node within the network represents a local region, and the edges contain the information of average travel time between each node as edge weights.
Medical emergency events were probabilistically generated across all nodes, with higher crime neighborhoods having a higher probability of such emergencies happening. The crime rate data was obtained from the London Metropolitan Police database. Reported crime is not necessarily a direct cause of medical emergencies, nor all medical emergencies arise from reported crime. However, it was assumed as an approximate indicator of the probability of ambulance request in each node, due to the difficulty of obtaining datasets directly logging ambulance requests.
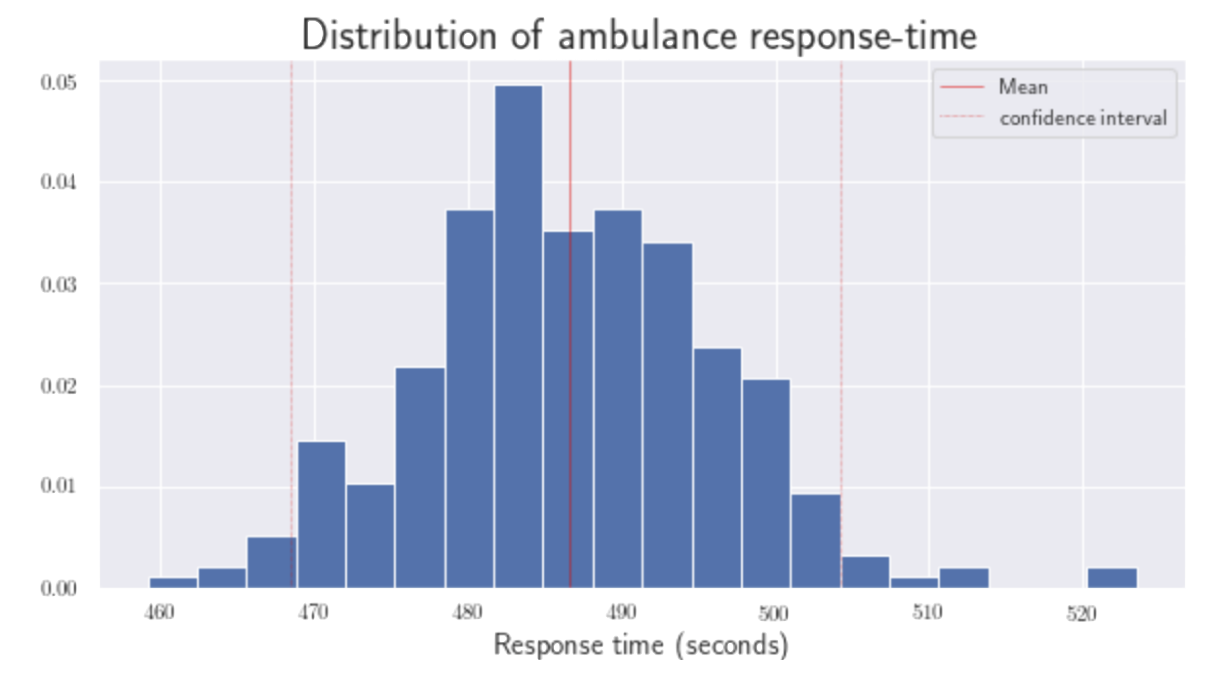
Using the travel time data from Q1/20, a simulation was run 300 times, each with 1000 total medical emergencies. The ambulance velocity was controlled at 20 km/h.(±2σ). This is the controlled set of simulations.
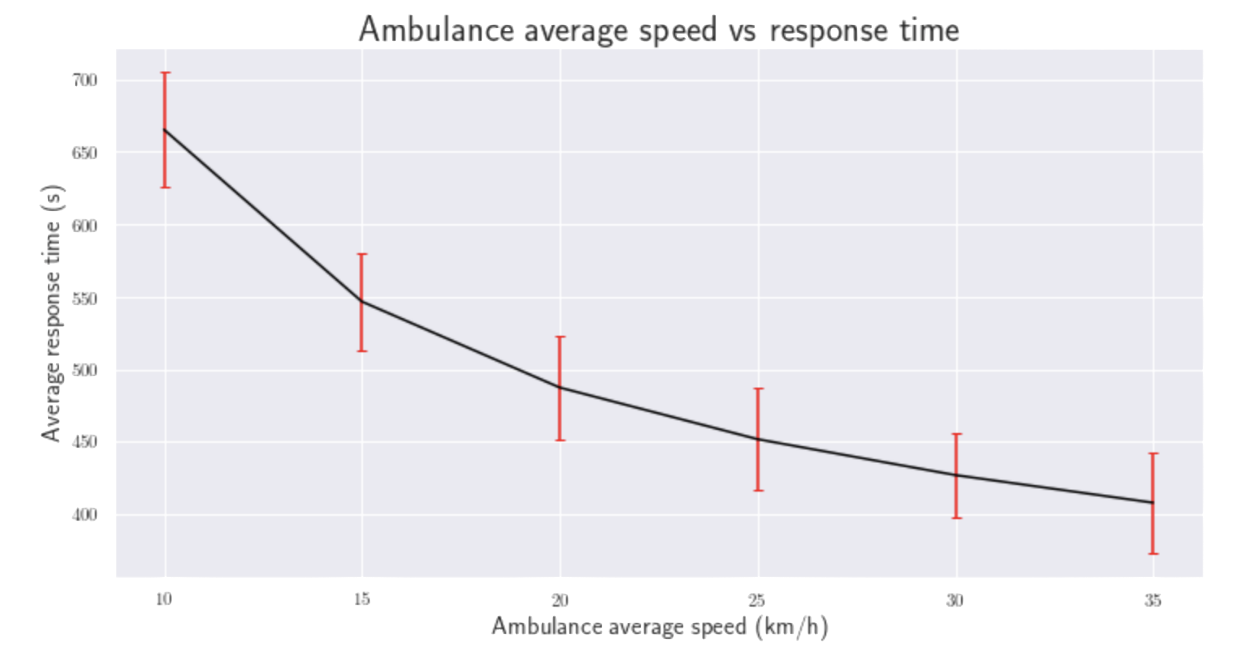
I first compared the effect of changing average ambulance speed on response time. Intuitively enough, the response time improves with higher average ambulance speed. This can be achieved in several ways; such as allowing the ambulance to excess local speed limits and/or skip red lights as appropriate.
I was interested in what other factors additionally influenced response times. I decided to also simulate the effect of 8 Thames bridges closing down separately. This was done by removing the corresponding edges in the network.
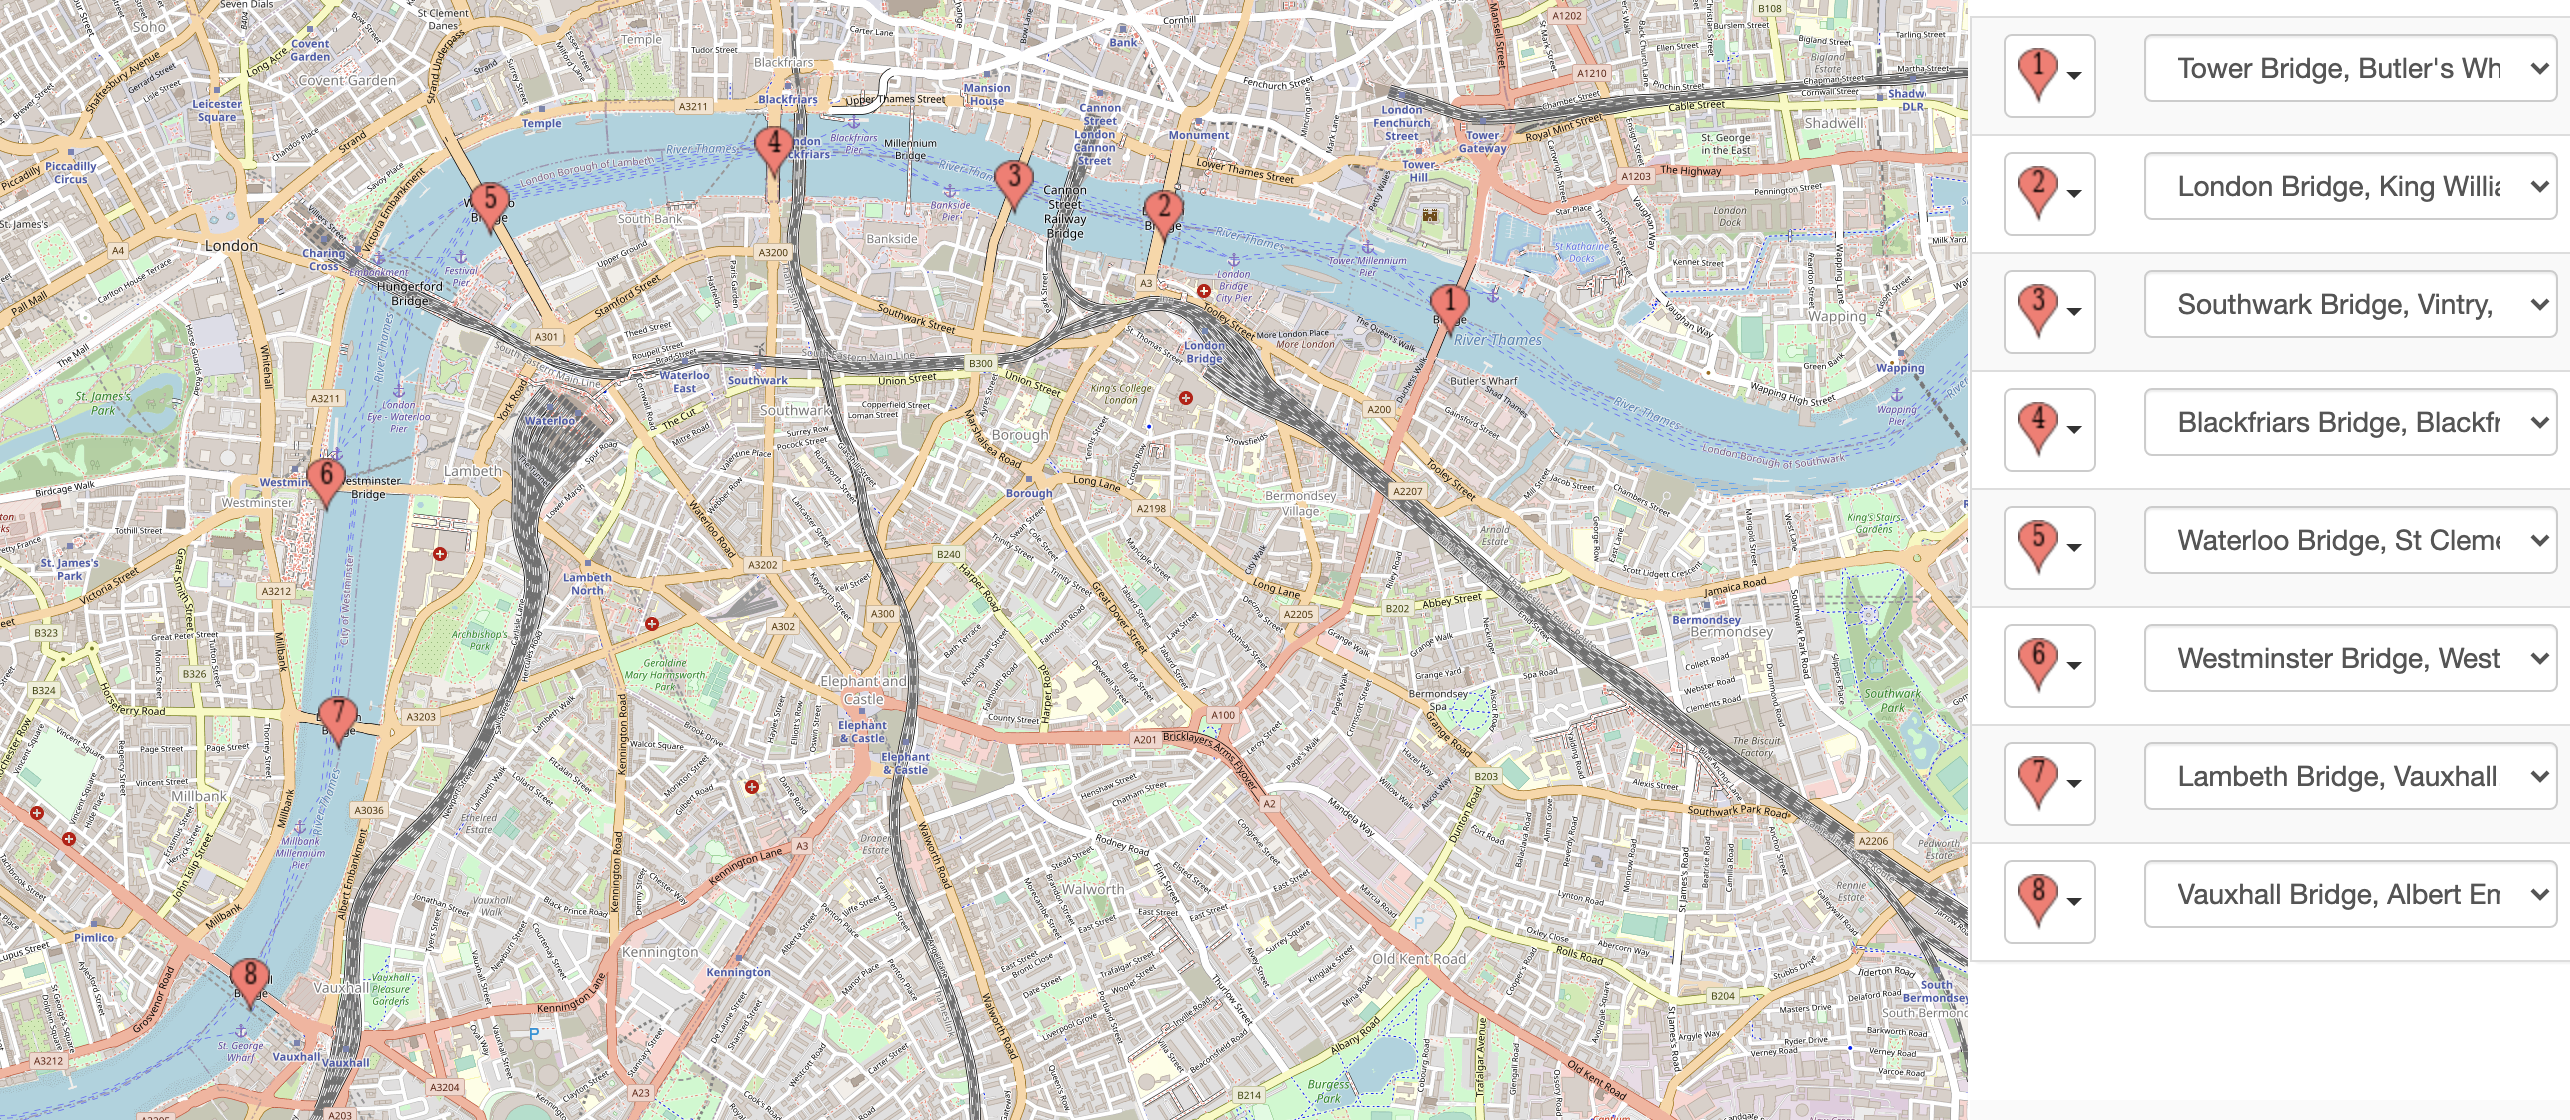
Closing down Lambeth bridge had the most significant slowdown effect on ambulance response (±2σ).
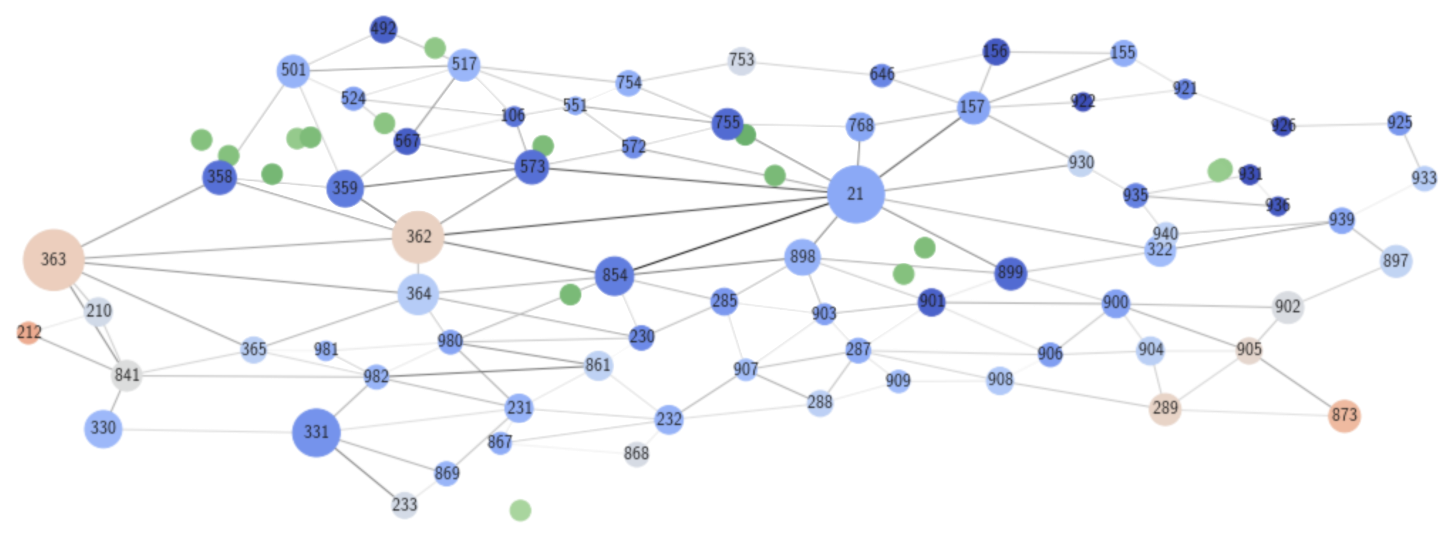
At this point, I wanted to explore how to most optimally place additional hospitals within central London to improve the overall emergency response time in the area. I examined some of the worst-responded nodes in the default simulation to identify the particularly vulnerable and inaccessible neighborhoods. Once I had identified them, I ran new simulations with a hypothetical placement of one additional hospital in a node belonging to such a neighborhood.
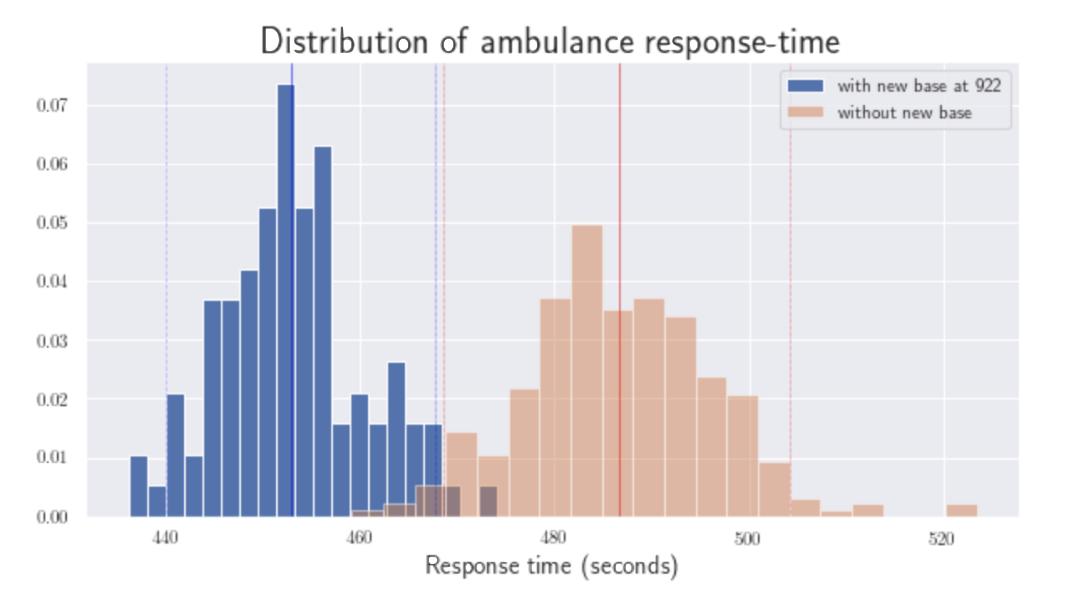
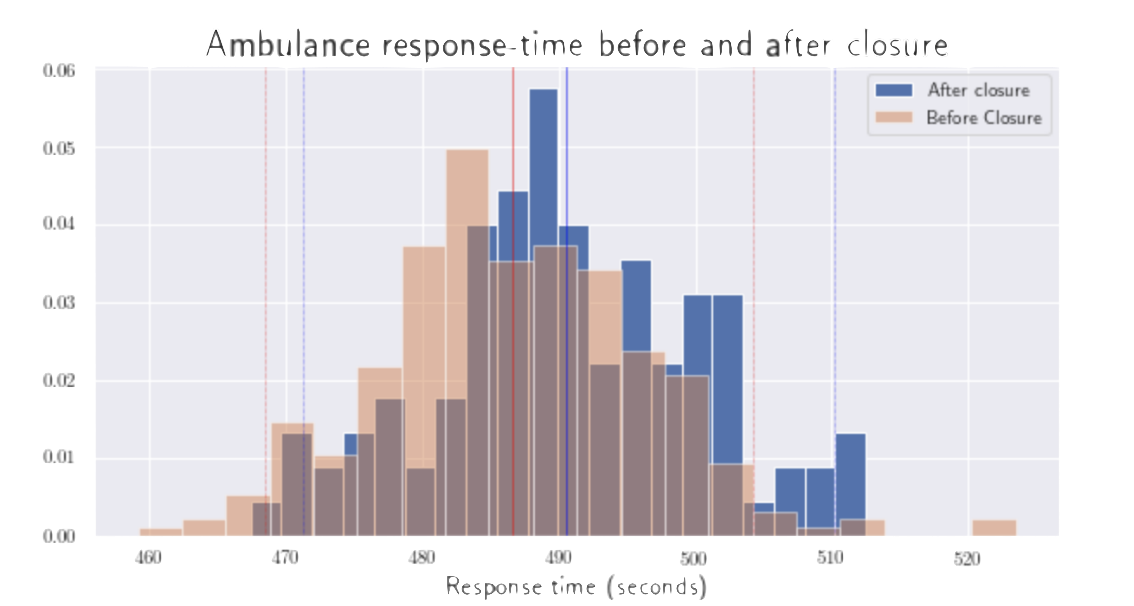
For example, adding a hospital in node 922 yielded approximately 30 seconds of expected improvement per response overall; in a matter of life or death, this improvement can save or kill a life. The comparison below shows us that three strategic additional hospitals will significantly improves the pain regions in the northeast and southwest.